The Science of collecting, organizing, presenting, analyzing and interpreting the data is statistics. It is one of the most important disciplines or methods to get a deeper insight into data. Statistical analysis is implemented to manipulate, summarize and investigate data so that useful information can be obtained.
Take away from this post:
- Types of Statistics: Descriptive vs Inferential
- Basic terminology like Population vs Sample
- Types of Variables: Numerical vs Categorical
- Measures of central tendencies: Mean, Median and Mode and their specific use cases
- Measures of dispersion/spread: Variance, standard deviation etc.
Data Visualization using plotly, matplotlib, seaborn and squarify
Insight Discovery from large Data set.
Suppose a retail company wants to send a campaign to the customer so How does the company find out whether the campaign is working? How many customers are clicking on the ads? How many customers are actually buying the products?
Hence to get all these answers we do statistical analysis.
Types of statistics:
- Descriptive
- Inferential
Descriptive analysis is a method of organizing, summarizing and presenting the data in an informative way. Example:
- How many customers are coming to the store?
- In which months it sells more?
- Which product sells more at what point of time? Etc…
Inferential statistics used in determining something about a population on the basis of its sample. Example:
Suppose you want to run a poll for the upcoming elections, you can not go to every single person to ask their opinion. Hence you have to select a sample of people and based on that sample you try to infer which party is going to get more votes.

Some Basic Terminologies:
Population: The entire set of individuals or objects of interest
Sample: A portion or a part of the population of interest.

Note: population can be finite or infinite such as no. of customers(finite) or no. of stars(infinite).
Variable: A characteristic of each individual element of a population/sample.
Data: A value of the variable associated with one element of a population or sample.it can be numbers, words or symbols.
Experiment: A planned activity whose result yields a set of data.
Parameter: A numerical value which summarizes the entire population or the descriptive measure of the population. For example, population mean, population variance, population standard deviation, etc.
Statistic: A numerical value which summarizes the sample data or descriptive measure of the sample. For example, sample mean, sample variance, sample standard deviation, etc.
Types of the variable:

The Measure of a Central Tendency:
- Mean
- Median
- Mode
Mean: It is nothing but the average of the data set. Mean can be easily calculated by dividing the sum of data points with the no. of data points.
e.g. We have the blood pressure of middle age men
151, 124, 132, 170, 146, 124, 113
Mean µ= (151+124+132+170+146+124+113)/7 =137.14
The mean is mostly used as the general indicator of the midpoint of the data. However, it doesn’t work best when there are a lot of outliers in the data.
Median: To calculate median, data set should be arranged in increasing order and then median would be:
If N is odd no. then the median is the middle-value of the data set. i.e. (n+1)/2 th element.
If N is even no. then the median would be the average of two middle values of the data set. i.e. avg of n/2 th and (n/2 +1) th elements.
Hence for the previous data set i.e. 151, 124, 132, 170, 146, 124, 113
In increasing order: 113,124,124,132,146,151,170
N= odd no. hence the median = 132
The median is used where the outliers present in the data.
Example: The salaries of staff members is given below:
Staff salary = 15k, 18k, 16k, 14k, 15k, 15k, 12k, 17k, 90k, 95k (bold one’s are outliers)
The mean salary for these ten staff is 30.7k. which is nowhere representing the center tendency of the data set because most members have a salary between 12k to 18k.
The mean is being unbalanced because of the two large salaries present in the data set. let’s find out if taking the median would be a better measure of central tendency in this situation.
12k, 14k, 15k, 15k, 15k, 16k, 17k,18k, 90k,95k
Median= 15.5k
Hence the median is closely representing the situation of the group. So median is used mostly when there are outliers in data set.
Mode: The most frequently occurring value in the data set.
Hence for the above example, the mode of the salaries would be 15K. The mode is not often used in describing data. But can be used in certain circumstances, such as in a class of 70 students, 50 students are 7 years old and rest students are between 6 to 8 hence the mode of the age of students will be 7.
Mode is frequently used in categorical data set. or if we can define the given set of values as categorical. as in above example we deduce the category as 7 year old and 6 to 8 year old students. Hence the mode is 7 which is nothing but the most occurring value.
The relationship between Mean, Median and Mode is:
Mean-Mode=3*(Mean-Median)
Mean and Median need not be in the data set but
Mode has to be in it.
Measures of Dispersion/Spread:
The Measures of center tendencies are not enough to describe the data. Two different data sets can have the same mean, median and mode but still can be way too different from each other.
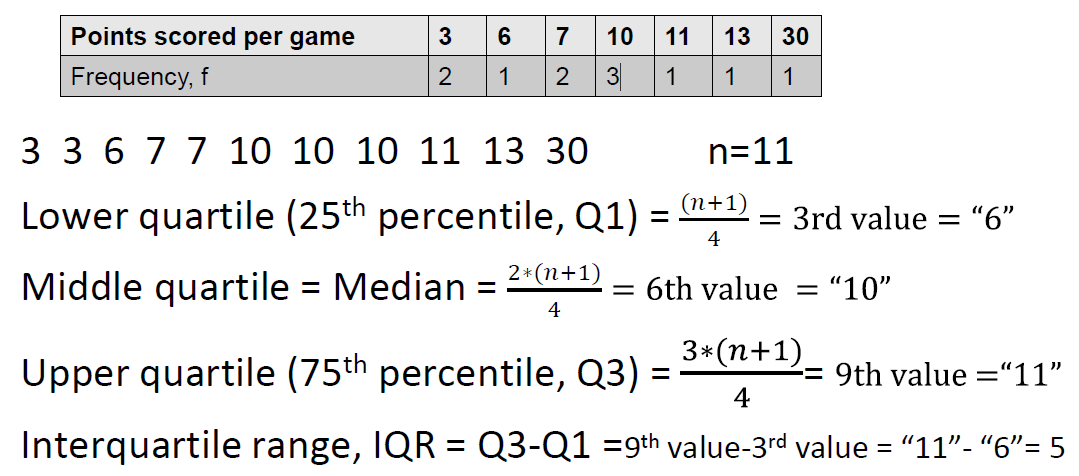
Basketball coach Statson is in a dilemma choosing between 3 players all having the same average scores.

Mean = Median = Mode = 10 for all 3.
Hence we need the measure of desperation to calculate the variability or dispersion within the data set. Range, Quartile, variance, and standard deviation are commonly used measures of dispersion.
Range: The difference between the largest and smallest observation of the sample is the range. The range can be useful if we are measuring a variable which either has the critically high or low value that should not be crossed.
The range will instantly inform your weather any crossed the critical threshold. hence it can be very useful to detect errors while entering data.
Suppose while recording the age of school students your range is 7 to 123 year. you will immediately know that you made a mistake. So conclusion would be there is some typing error as age cant be 123 (excluding exceptions 😉 )
Quartile and interquartile range: Quartile breaks the data set into quartile, just like median breaks in into half.
Example 1 where N is odd:
Example 2 where N is even:
2, 5, 5, 8, 10, 21, 13, 14, 16, 64, 45, 12.
Arrange the data set into increasing order:
2, 4, 5, 8, 10, 12 13, 14, 16, 21, 45, 64. N= 12
The lower quartile Q1 = avg of [n/4 and (n/4 +1)] th values = (5+8)/2=6.5
The middle quartile is which is also a median, Q2 = avg of [2*(n/4) and 2*(n/4) + 1] the value = avg of [2*3 rd value and (2*3 + 1) th value] = avg of (6th value and 7th value) = (12+13)/2=12.5
The third quartile is between Q3 = avg of [3*(n/4) and 3*(n/4) + 1] the value = avg of [3*3 rd value and (3*3 + 1) th value] = avg of (9th value and 10th value) =(16+21)/2=18.5
Quartiles are useful measures because they are much less affected by the outliers and the skewed data. Hence quartile is often reported with the median as the best measure of the spread and center tendencies.
A common way to express quartile is as an interquartile range which is the difference between the third and first quartile.
Interquartile range= Q3-Q1= 18.5-6.5= 12
Semi interquartile range= (Q3-Q1)/2= 6
Quartiles are useful but somewhat limited as well. They do not take into account every single data of the data set. Hence to overcome this drawback we have measures like absolute deviation, variance, and standard deviation.
Absolute deviation and Mean Absolute Deviation: The absolute and mean deviation shows the amount of variation or deviation that occurs around the mean.
To find the total variability in the data set, simply add up the difference of each score and the mean. Then calculate the average deviation by dividing this total by the number of scores.
Mean absolute deviation: |x-µ|/n
Suppose you have posted 6 pictures on the Instagram and no. of likes on each picture is listed below:
10, 15, 15, 17, 18, 21
Mean = 96/6=16
Distance between each pint and the mean:
|10-16|=6,
|15-16|=1,
|15-16|=1,
|17-16|=1,
|18-16|=2,
|21-16|=5,
Since we are only interested in the deviation of the scores from the mean
Sum of distances/deviations= 6+1+1+1+2+5= 16
Mean average deviation=16/6=2.66
On average, each picture was about 3 likes away from the mean.
Variance: Unlike the absolute deviation, the variance achieves the positive values by squaring each of the deviations from the mean. To calculate the variance simply add up the squared difference of each score and the mean. Then calculate the average deviation by dividing this total by the number of scores.
Variance= ∑(X-µ)²/N
If the scores in our data sets are spread out then the variance will be the large no.
Conversely, if the scores are spread closely around the mean then the variance will be the smaller no.
As the deviation of scores from the mean is squared hence it gives more weight to extreme scores. If our data contains outliers, it can give undue weight to these scores.
The variance is not in the same units as the scores in the data set. It is in the units square. Hence it can not directly relate to the values in our data set.
To rectify these problems we calculate the standard deviation.
Standard deviation:
The standard deviation is a measure of the spread of the scores within the data set. In most of the cases we are presented with the sample only and based on that we have to make predictions about populations
Sample standard deviation
S= √(x-µ)²/(n-1)
Population standard deviation
σ=√(x-µ)²/(N
Feel free to contact us for more details and discussions.

8 comments