Statistics is a fundamental part of data analytics and machine learning. It enables you to analyze and visualize data in order to uncover previous patterns that are not seen. If you are willing to try your hand in machine learning and want to advance your career in it, the first step should be to learn statistics as well as programming.
This article will teach you all of the statistics concepts needed for machine learning.
What Exactly Is Statistics All About?
Statistics is a subject and a branch of mathematics that is related to all the collection, analysis, interpretation, and visualization of empirical data, and there are two major areas of statistics are descriptive statistics and inferential statistics. If we talk about, descriptive statistics are used to describe the characteristics of sample and population data (what has happened). These properties are used by inferential statistics to test hypotheses, reach conclusions, and make predictions (what can you expect).
Uses of Machine Learning and Statistics
- Posing data-related inquiries
- Data cleaning and preprocessing.
- Choosing the Best Features.
- Model assessment.
- Model forecasting.
With this fundamental understanding, it’s time to delve deep into learning all of the critical statistics concepts for machine learning.
Sample and Population
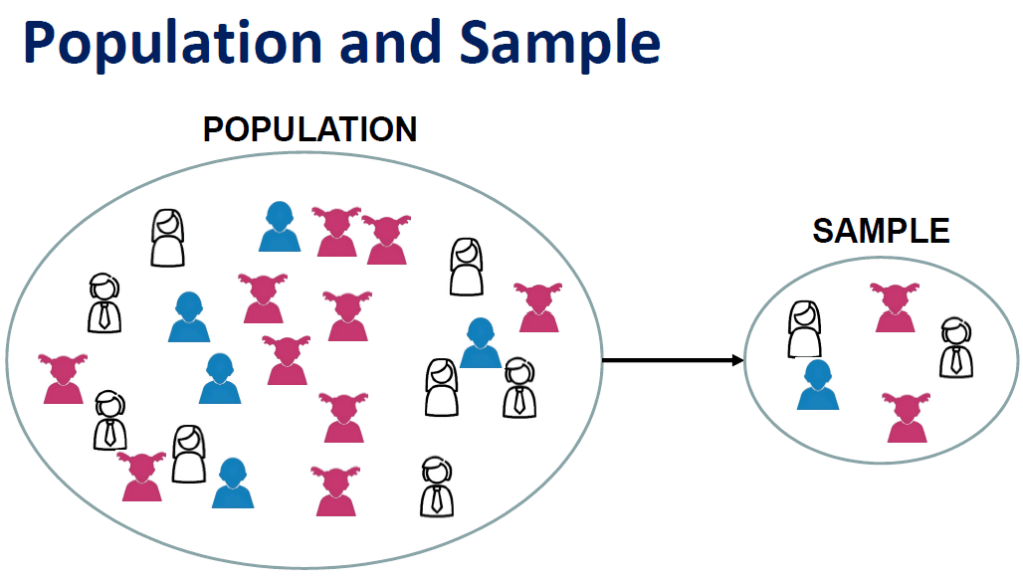
Sample:
A sample in terms of population is a subset of the population in statistics. It accounts for a small proportion of the total observed population. Analyzing first-time voters for an opinion poll is an example of a sample.
Population:
In statistics, the population is made up of all observations (data points) about the subject under investigation. An example of a population is studying election voters. About 900 million voters were eligible to vote in 543 Lok Sabha constituencies in the 2019 Lok Sabha elections.
Central Tendency Measures
Measures of central tendency are those that use a single value to describe the distribution of data. There are three types of central tendency measures, and that is mean, median and mode.
Mean:
The arithmetic mean represents the average of all data points.
If there are n observations and xi is the ith observation, and the mean is as follows:
In Python, you can use the mean() and average() functions to determine the mean or average salary of the employees.
Median:
After sorting the given data in ascending order, the median is the middle value that divides the data into two equal parts. The median is the value at a position of (n+1)/2 if the total number of data points (n) is odd. Median is defined as the average value of observations at n/2 and (n+2)/2 positions when the total number of observations i.e. (n), is even. In Python, the median() function can help you find the median value of a column.
Mode:
The mode is the data set’s most frequent observation (value). A dataset may contain more than one mode.
Here is the heights of students in a class (in cm):
156, 157, 160, 159, 162, 160, 161, 165, 160, 158
Mode = 160 cm.
Variance:
Variance is used to quantify the deviation of data from the mean.
Standard Deviation:
In statistics, the standard deviation is the square root of the variance. The measures of fit are variance and standard deviation, which indicate how well the mean represents the data. In Python, the std() function can be used to calculate the standard deviation.
Range:
In statistics, the range is defined as the difference between the dataset’s maximum and minimum values.
Interquartile Range (IQR) :
The IQR is a measure of the difference between the first and third quartiles (Q3).
Skewness:
Skewness is a measure of the distribution’s shape.
When the proportion of data at equal distances from the mean (or median) is equal, the distribution is symmetrical.
It is right-skewed if the values extend to the right and left-skewed if the values extend to the left.
Kurtosis:
In statistics, kurtosis is used to determine whether the tails of a given distribution have extreme values. It is also the shape of a probability distribution.
It is now time to discuss the Gaussian Distribution, which is a very popular distribution in statistics for machine learning.
Gaussian Distribution
The Gaussian (normal) distribution is a popular continuous probability distribution for any random variable in statistics and probability. It is defined by two parameters (mean and standard deviation). Many natural phenomena, such as people’s heights and IQ scores, have a normal distribution.
Gaussian Distribution Characteristics:
- The mean, median, and mode are all the same values.
- It has a bell shape that is symmetrical.
- Sixty-eight percent of the data is within one standard deviation of the mean.
- 95 percent of the data are within two standard deviations of the mean.
- 99.7% of the data are within three standard deviations of the mean.
The theorem of the Central Limit
The theorem of central limit states that if you take large random samples from a population with mean and standard deviation, the distribution of the sample means will be roughly normally distributed, regardless of the original population distribution.
The sample size should always be greater than or equal to 30 in order for the central limit theorem to hold true.
Hypothesis Validation
Hypothesis testing is defined as a statistical analysis that uses experimental data to make decisions. It enables you to statistically back up some conclusions drawn from data analysis. In hypothesis testing, you make a claim about population parameters such as mean, median, standard deviation, and so on.
- The null hypothesis is the assumption made for a statistical test (H0).
- The null hypothesis is contradicted by the alternative hypothesis (H1), which states that the assumptions are not always hold true at some level of significance.
- A null hypothesis can be rejected or retained using hypothesis testing.
- The p-value must be interpreted to determine whether a finding is statistically significant.
- The p-value is frequently compared to a value known as the significance level.
- It frequently sets the level of significance to 5% or 0.05.
- Accept the null hypothesis if the p-value is greater than 0.05.
- If the value of p is less than 0.05, the null hypothesis is rejected.
The following are some examples of popular hypothesis tests:
- Chi-square analysis
- T-test
- Z-test
- Variance Analysis (ANOVA)
Conclusion
Statistics is an integral part of machine learning.
It assists you in reaching meaningful conclusions by analyzing raw data. In this article, you touched all of the critical topics that are widely used to make sense of data. To build a strong foundation, you can also take up a free Statistics for Machine Learning course from Great Learning.
