Feature selection is a way to reduce the number of features and hence reduce the computational complexity of the model. Many times feature selection becomes very useful to overcome with overfitting problem. It helps us in determining the smallest set of features that are needed to predict the response variable with high accuracy. if we ask the model, does adding new features, necessarily increase the model performance significantly? if not then why to add those new features which are only going to increase model complexity.
So now lets understand how can we select the important set of features out of total available features in the given data set.
It is always better to understand with an example. So lets look at the mtcars data set below in R:

we will remove column x as it contains only car modals and it will not add much value in prediction.

In the above data there are 12 features (x, mpg, cyl, disp, hp, drat, wt, qsec, vs, am, gear, carb) and we want to predict the mpg (miles per gallon) hence it becomes our target/response variable.
Lets randomly select any of the predictor variable and try to fit the model for predicting mpg. lets start with wt then:

Three stars (or asterisks) represent a highly significant p-value. Consequently, a small p-value for the intercept and the slope indicates that we can reject the null hypothesis which allows us to conclude that there is a strong relationship between mpg and weight. Typically, a p-value of 5% (.05) or less is a good cut-off point. In our model example, the p-values are very close to zero. Also R-squared value .74 tells us that around 74% of variance in target variable is explained by the model hence model is also significant.
Now lets fit the model with two variables wt and hp (horse power) as below: (note we can go with any two randomly picked predictors as we are just trying to understand what happens if we go with hit and trial method)

Now R-squared value has increased to .81 from .74. which means model has become more significant. Also looking into the no of stars against wt and hp we can say both are strongly related to target variable and hence both are important.
There might be the case that by adding new variable impact of already added variables decreases, in that case if p value crosses the upper threshold of .05 for any old variables then it means that variable now has become insignificant then we remove that variable.
now add one more variable qsec and analyze the model summary as below:

Logically by adding new variable it should not reduce the impact of already added variables but in this case as we can see in above image that variable hp and qsec both become insignificant (p-value > .05 also there is no star).
Now lets add all the variable and see what happens:
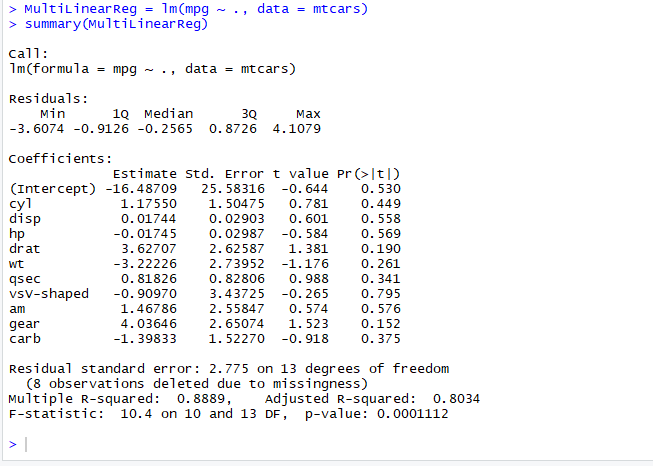
From above summary we see that none of the variable is significant as all p values are greater than the threshold limit .05, also summary has not produces any stars as significant code. This is kind of surprising. if no variable is significant then how to fit the model?
So if we do hit and try method with all combinations of the variable then there will be total 2^k – 1 linear models we have to try and see which are the significant features. isn’t this a time consuming job, of-course yes. so what to be done now? Here comes the feature selection techniques which helps us in finding the smallest set of features which produces the significant model fit. So in Regression very frequent used techniques for feature selection are as following:
- Stepwise Regression
- Forward Selection
- Backward Elimination
1. Stepwise Regression
In Stepwise regression technique we start fitting the model with each individual predictor and see which one has the lowest p-value. Then pick that variable and then fit the model using two variable one which we already selected in previous step and taking one by one all remaining ones. Again we select the one which has the lowest p-value. Also keep in mind that by adding the new variable, impact of already selected variable in previous step should still be significant. We keep this iteration until we get a combination whose p-value is less than the threshold of .05.
Lets understand this whole process using one example:
Step 1:
we fit the model with one predictor and target. We tried each predictor one by one and below each row represents the model fit with respective t-score, p-value and R-squared value. As we see mpg ~ wt fit has lowest p-value (also should be less than .05) so will select wt and go to step 2.
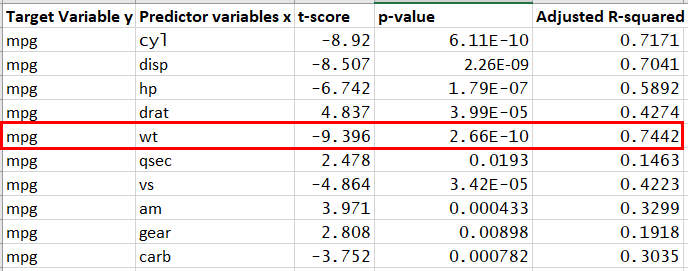
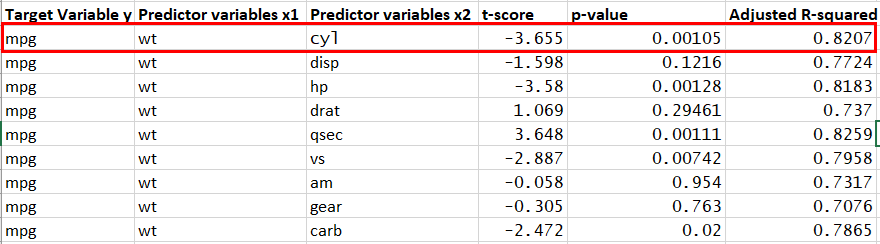
Step 2:
Now we will fit the model with two predictors. one we have already selected as wt in step 1 and for second predictor we will try one by one with all remaining predictors. And will again select those which have lowest p-value. in this case we got wt and cyl.
Step 3:
Now will try to fit with 3 predictors two already selected in step 2 and third will try with remaining one’s. but here we see none of the p-value is less than .05, hence none are significant.
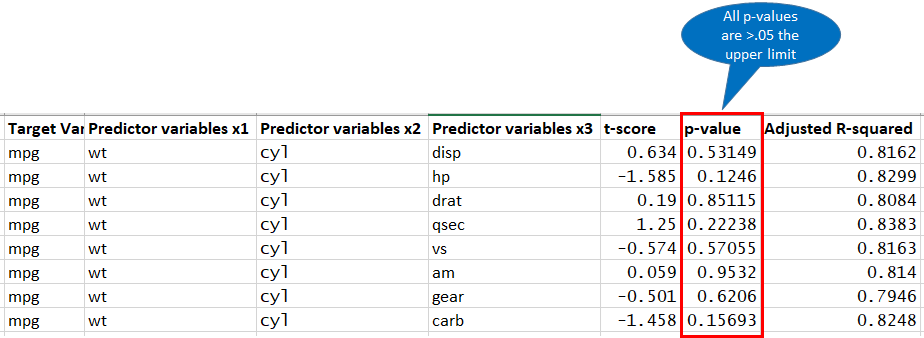
As all p-values are greater than .05 hence none of the three combination features are going to be significant. hence we stop here.
So using Stepwise regression we have got smallest set {wt, cyl} of features which have significance impact in final model fit. It does not mean other features do not have impact but they have very less impact which can be neglected if we are getting significant model fit with only two variables.
So here we have observed that our search space has reduced drastically as compared to hit and trial method where we have to compare the 2^10 – 1 = 1023 models.
2. Forward Selection
Forward selection is almost similar to Stepwise regression however only difference is that in forward selection we only keep adding the features. We do not delete the already added feature. in every iteration we add only those feature which increases the overall model fit.
3. Backward Elimination
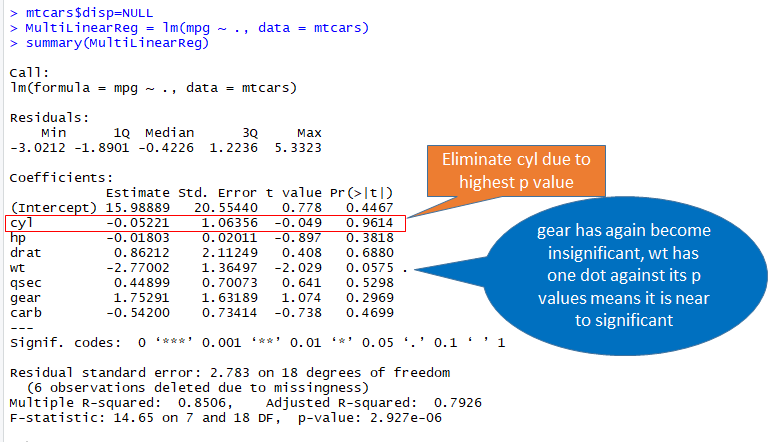
In backward elimination in first step we include all predictors and in subsequent steps, keep on removing the one which has highest p-value (>.05 the threshold limit). after few iterations it will produce the final set of features which are enough significant to predict the outcome with desired accuracy.
we will take same example of mtcars data set and go step by step as following:
Step 1:
In step 1 we build the model with all the features available in the data set. Then observe few things:

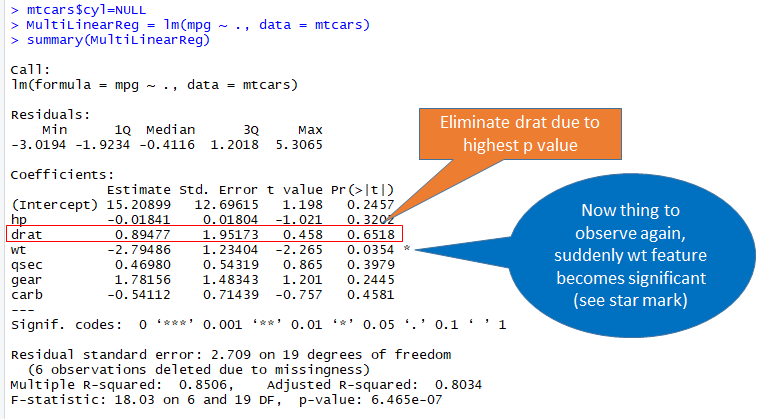
Step 2

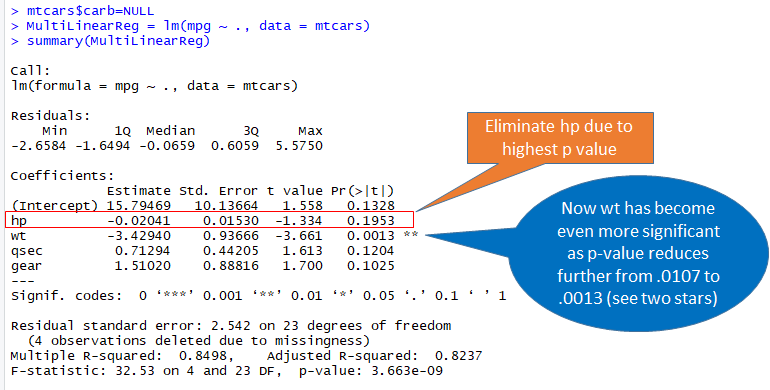
Step 3

Step 4
Step 5
Step 6

Step 7
Step 8

Step 9
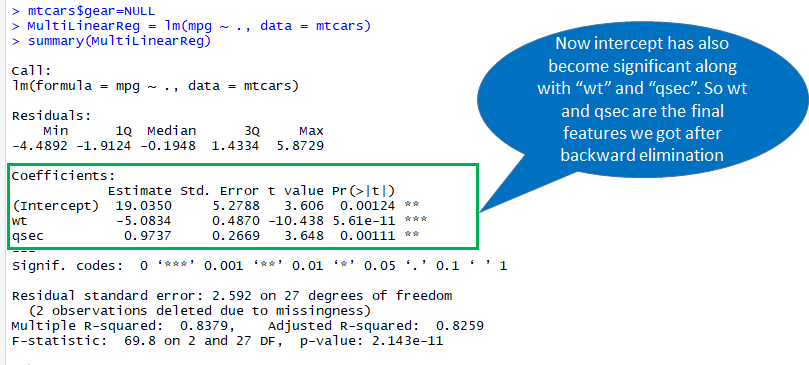
At the end we got {wt, qsec} as smallest set of features. So now lets see the interesting thing, here whether backward elimination produces the same set of features which we got using Stepwise regression. Using Stepwise regression we have got {wt, cyl} as the best possible smallest set of features.
One more thing we can conclude that it is not always true that we will get same set of features with all the feature selection techniques. We have to select different techniques smartly based on the business problem and our understanding.
So that’s all about these three feature selection techniques. There are other techniques which are also equally important to understand, those I will be writing in my upcoming posts.
Feel free to contact us for more details and discussions.

13 comments