Linear Regression is a field of study which emphasizes on the statistical relationship between two continuous variables known as Predictor and Response variables. (Note: when there are more than one predictor variables then it becomes multiple linear regression.)
- Predictor variable is most often denoted as x and also known as Independent variable.
- Response variable is most often denoted as y and also known as Dependent variable.
So what is the new term Statistical Relationship?
Before getting into Statistical Relationship we should know what is
deterministic relationship. (Note: Linear Regression is not about studying the deterministic or functional relationship however we should know about these relationships to better understand Linear Regression)
Deterministic Relationship: Relationship between two variables is called deterministic if one variable perfectly determines the other variable. for example if we know the radius of a circle then we can perfectly determine its circumference as
Circumference = 2 × π × radius
Similarly the relationship between degrees Fahrenheit and degrees Celsius is known to be:
Fahr = (9/5) × Cels + 32

So if we see the above graph it is very much clear that the observed (x,y) data points fall directly on a line without any deviation from the line which shows that they perfectly determine each other. With given Fahrenheit value it will determine exactly one Celsius value and vice-versa.
some other deterministic relationships are:
- Hooke’s Law: Y = α + βX, where Y = amount of stretch in a spring, and X = applied weight.
- Ohm’s Law: I = V/r, where V = voltage applied, r = resistance, and I = current.
- Boyle’s Law: For a constant temperature, P = α/V, where P = pressure, α = constant for each gas, and V = volume of gas.
Statistical Relationship:
Here is an example of a statistical relationship.
- The response variable y is the mortality due to skin cancer (number of deaths per 10 million people)
- Predictor variable x is the latitude (degrees North) at the center of each of 49 states in the U.S.
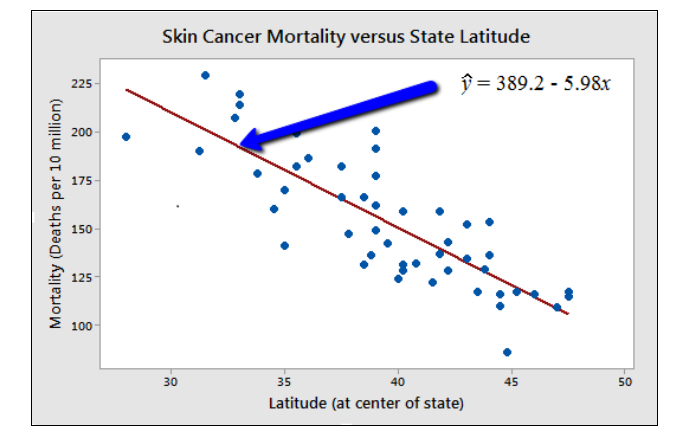
You might anticipate that if you lived in the higher latitudes of the northern U.S., the less exposed you’d be to the harmful rays of the sun, and therefore, the less risk you’d have of death due to skin cancer. The scatter plot supports such a hypothesis.
There appears to be a negative linear relationship between latitude and mortality due to skin cancer, but the relationship is not perfect. Indeed, the plot exhibits some “trend,” but it also exhibits some “scatter.” Therefore, it is a statistical relationship, not a deterministic one.
Some other examples of statistical relationships might include:
- Height and weight — as height increases, you’d expect weight to increase, but not perfectly.
- Alcohol consumed and blood alcohol content — as alcohol consumption increases, you’d expect one’s blood alcohol content to increase, but not perfectly.
- Vital lung capacity and pack-years of smoking — as amount of smoking increases (as quantified by the number of pack-years of smoking), you’d expect lung function (as quantified by vital lung capacity) to decrease, but not perfectly.
- Driving speed and gas mileage — as driving speed increases, you’d expect gas mileage to decrease, but not perfectly.
Hope you liked the article. Please share your Ideas / thoughts in the comments section below.
Feel free to contact us for more details and discussions.
Recommended: what-is-linear-regression-part 2
*Reference : https://www.psu.edu/

Very helpful and informative
LikeLike
Thank you.
LikeLike
Great Article. More informative
LikeLiked by 1 person
Thank you. Good to hear it is useful.
LikeLike